Getting Started with Althea Operator Tools
OVERVIEW
Welcome! Althea Operator Tools (a.k.a. Ops Tools) is an online dashboard with a suite of tools for monitoring, managing, and deploying networks based on the Althea platform. Operator Tools provides a centralized place to track both the technical and financial aspects of your network. Operator Tools can be accessed from any modern web browser, either on a desktop, laptop, or mobile device. You can have multiple instances of Operator Tools running simultaneously across all of your devices.
Operator Tools first login
- The Operator Tools login page is: https://operator.althea.net/
- We recommended that you bookmark that page for quick access
- Enter the username and password that were provided to you by Althea staff
- We recommend that you save these credentials in a secure password manager, such as Bitwarden
- When you first log in, you should see the Network Overview page, which looks like this:
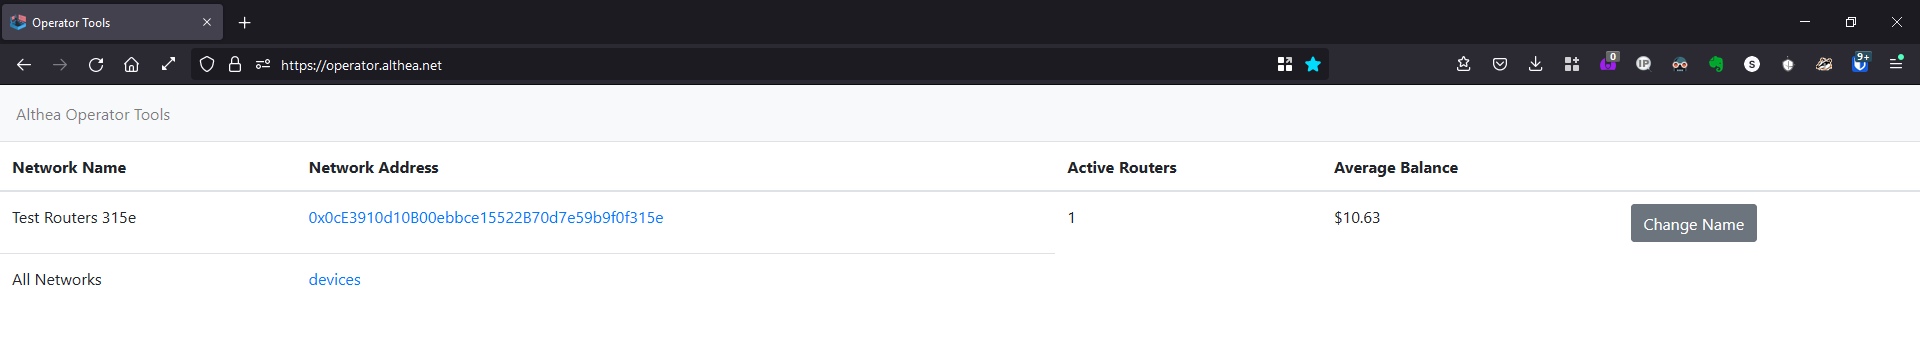
- This page may be blank, or populated with a single network, as shown above. The network address is what is known as the Network Organizer Payment Address, or just ‘Net Org Address’ for short. This address is the public key for a blockchain wallet, which serves multiple purposes in an Althea network. You can read more about a blockchain wallet’s role in an Althea network here: How Althea Works
- If your network overview page is blank (no network addresses are visible), then you’ll need to get your first Althea Gateway router online before returning to these steps. To get your router online, you can follow the steps in the guide How to - Althea Gateway Router. Once that router is online and providing internet access, resume this guide at step 4b. If you have completed the Althea Gateway Router guide and you still don’t see a network address on your Operator Tools dashboard, please contact Althea Support at hello@althea.net or 1-866-425-8432 (phone or SMS).
- You may change your network name at any time by clicking the gray ‘Change Name’ button to the right of the network details. We recommend adding the geographical location as part of the name to help with organization, such as:
- “BetterBroadband - Portland, OR, USA”
- “ABCNet - Paris, France”
- While you likely will have just one Net Org address when getting started, you may add more in the future, so it is a good practice to instill an organizational structure from the beginning. You can always change these network names in the future if needed. These names are only visible to you and Althea staff, they are not visible to your end users or subscribers.
- Click on the network address link, and you’ll see the dashboard for that network:
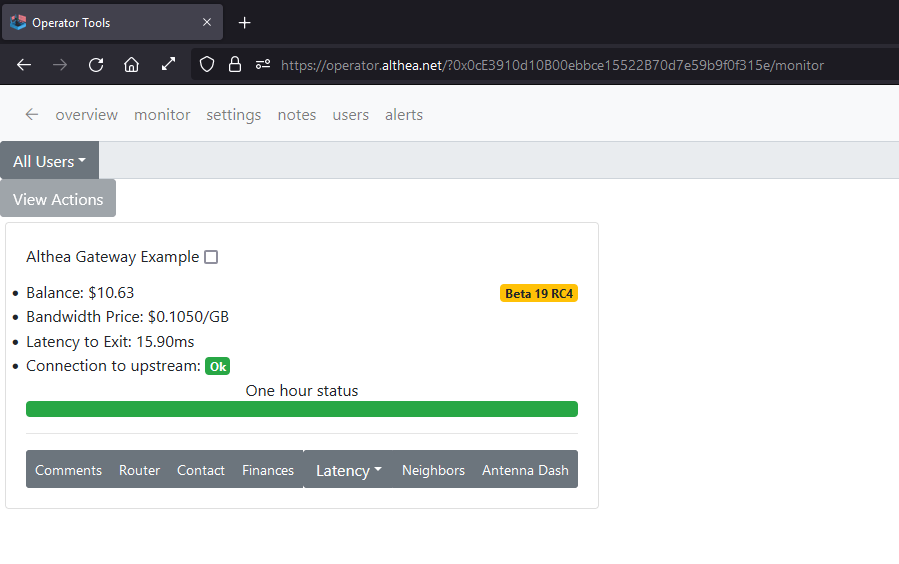
- Your network dashboard page should show one or more router cards, though it may be blank.
- If your network dashboard page is blank, first confirm your router is online. For assistance getting your router online, refer to How to - Althea Gateway Router. If your gateway router is already online and not showing up in your Ops Tools network dashboard, make sure that the ‘Organizer Payment Address’ (Router dashboard Advanced page) matches the public key you saw on the Network Overview page (step 4 above).
- Each router that is part of your network will have its own router card. A router card contains a collection of static information (fixed data, such as the IPv6 address (Mesh IP), Wireguard Public Key, etc.), as well as dynamic information (constantly changing data, such as router uptime, CPU temp, latency, etc.). Each router card has some fields that can be edited, and some fields that cannot be edited. Note that a router card can only show the ‘last known’ state of a router, so if a router is offline, the card will just show whatever information was true the last time that router checked in with the Ops Tools servers.
Operator Tools tour
Now that you are logged in and can see at least one router card, let’s take a tour of what Althea Operator Tools has to offer. We’ll go through each tab from left to right.
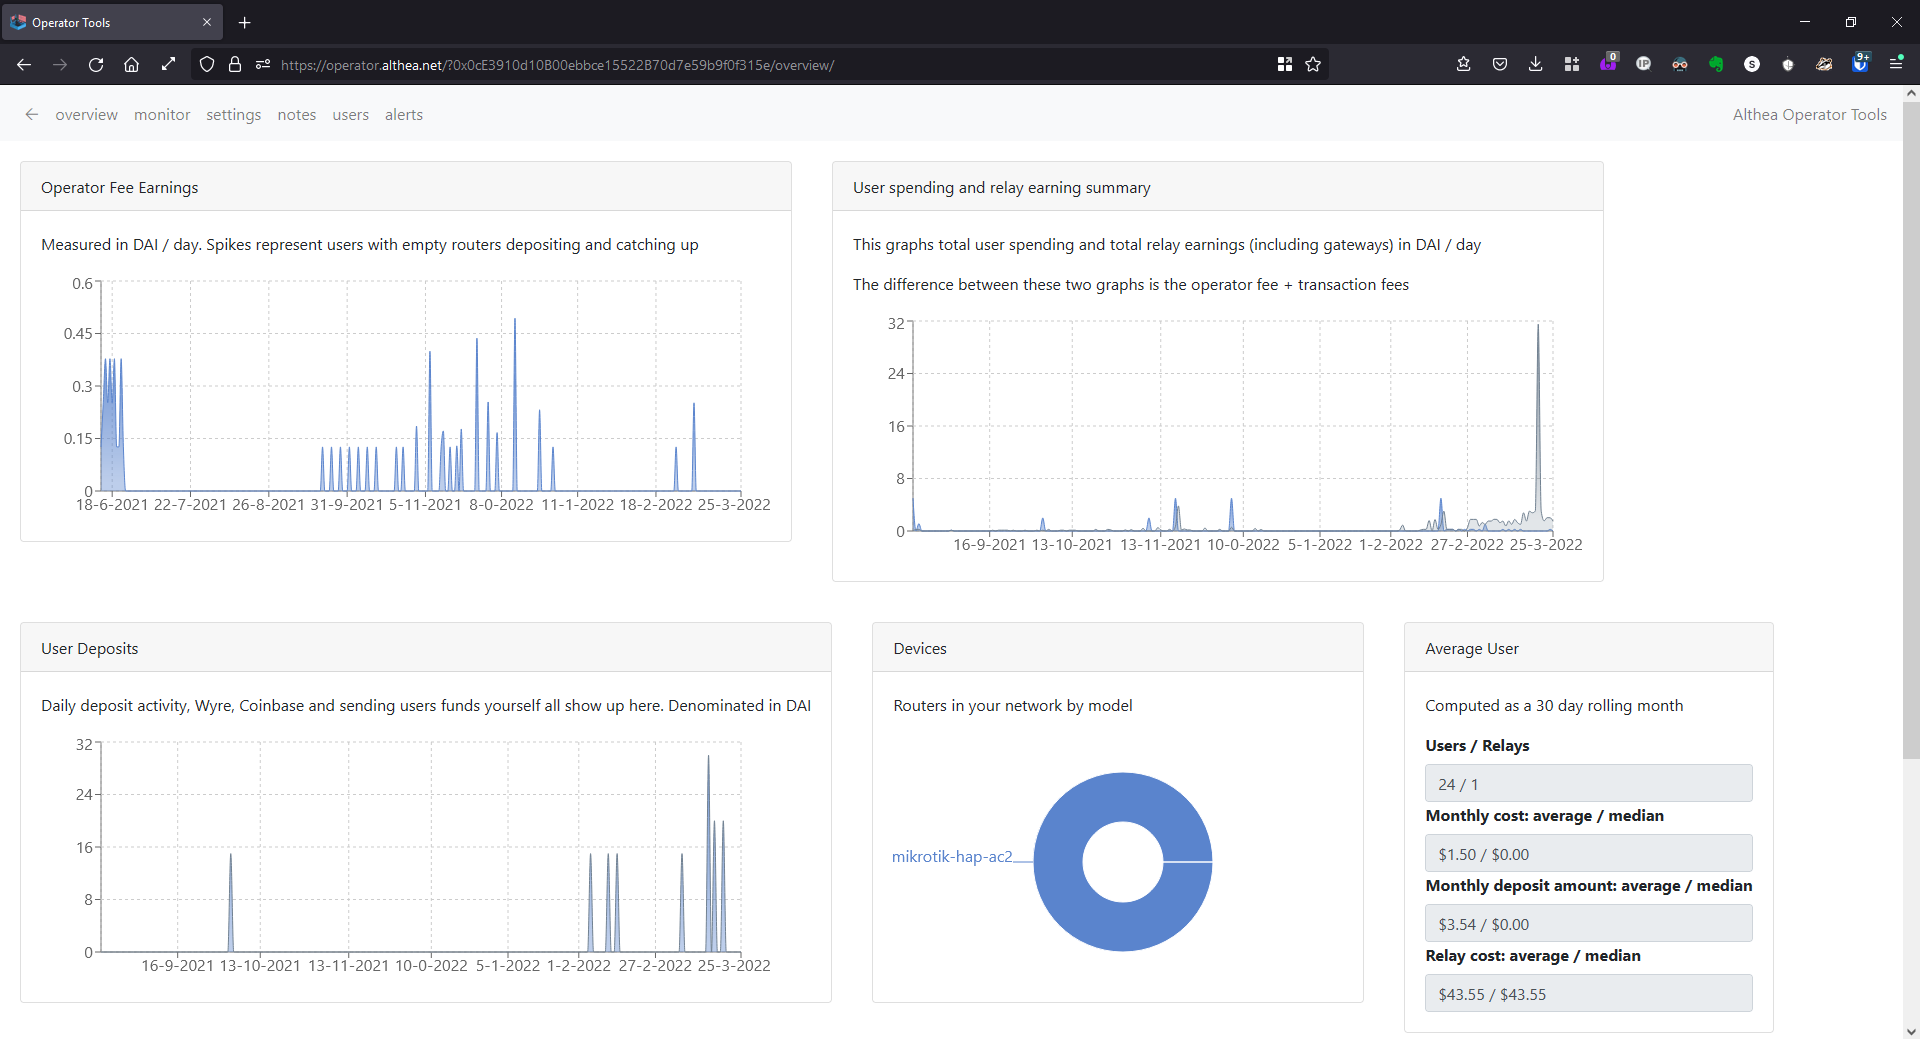
The Overview tab displays a series of charts and graphs related to your network. There won’t be much to see here at first, but over time this section will populate with data. One of the most useful metrics is the Average User/Monthly cost, in which you can see the average and median costs to your endpoint users.
The Monitor tab is where the action happens. This is an overview of all the routers in your network, both online and offline. an offline router will remain in the Monitor tab listing until the corresponding router card has been manually deleted.
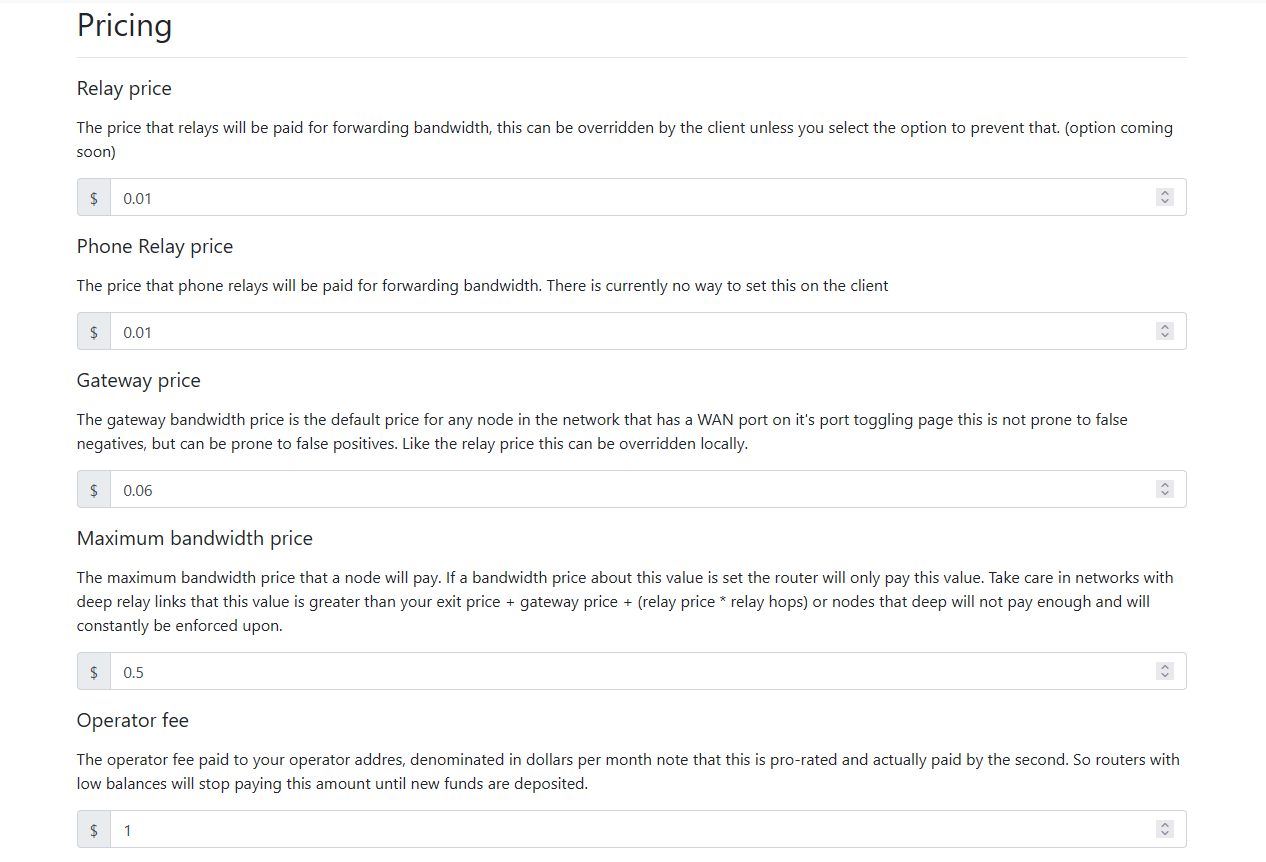
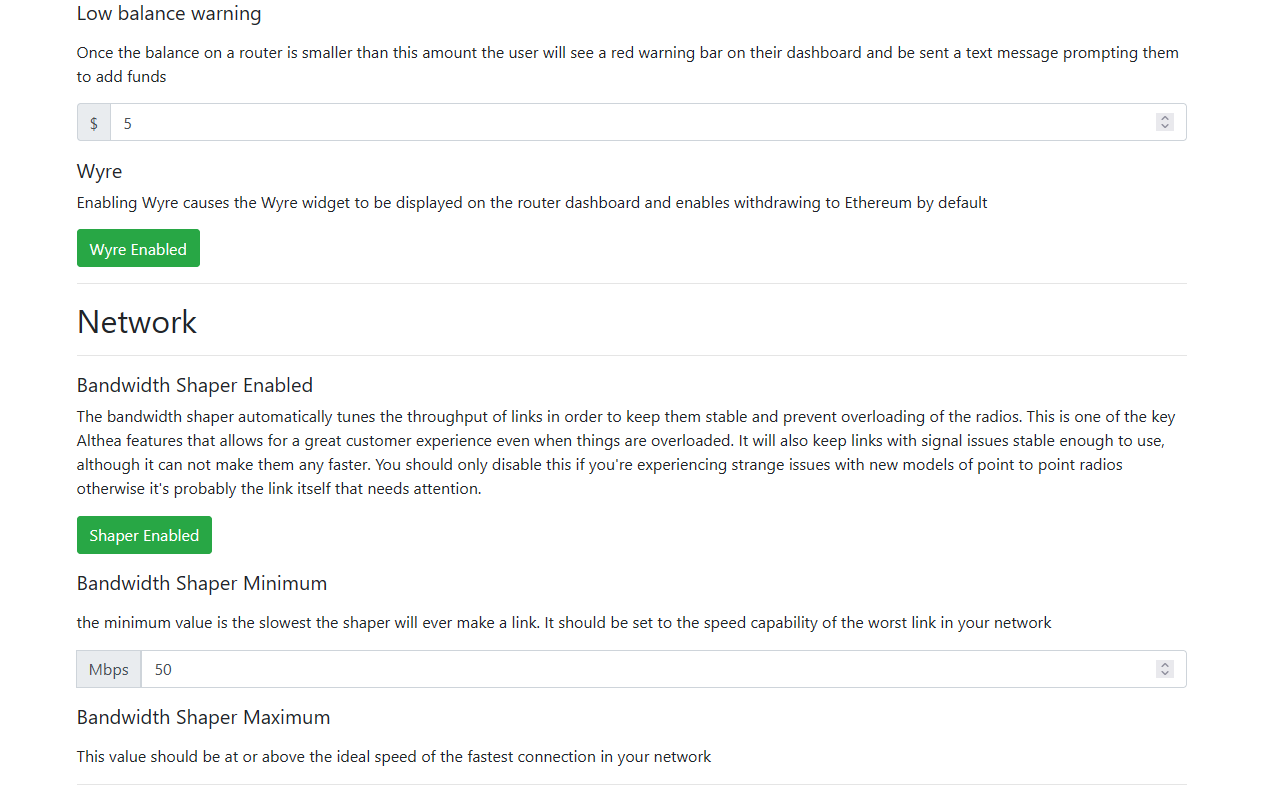
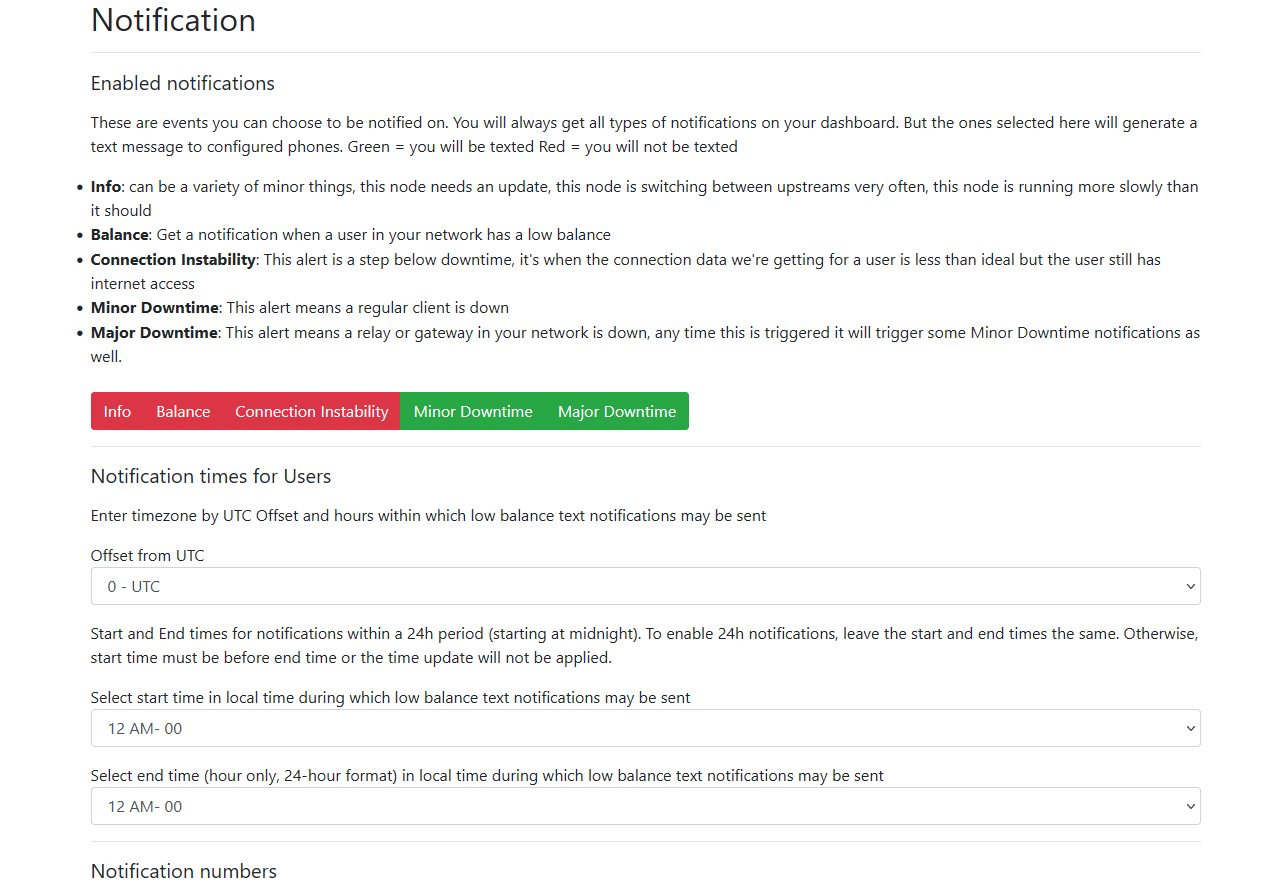
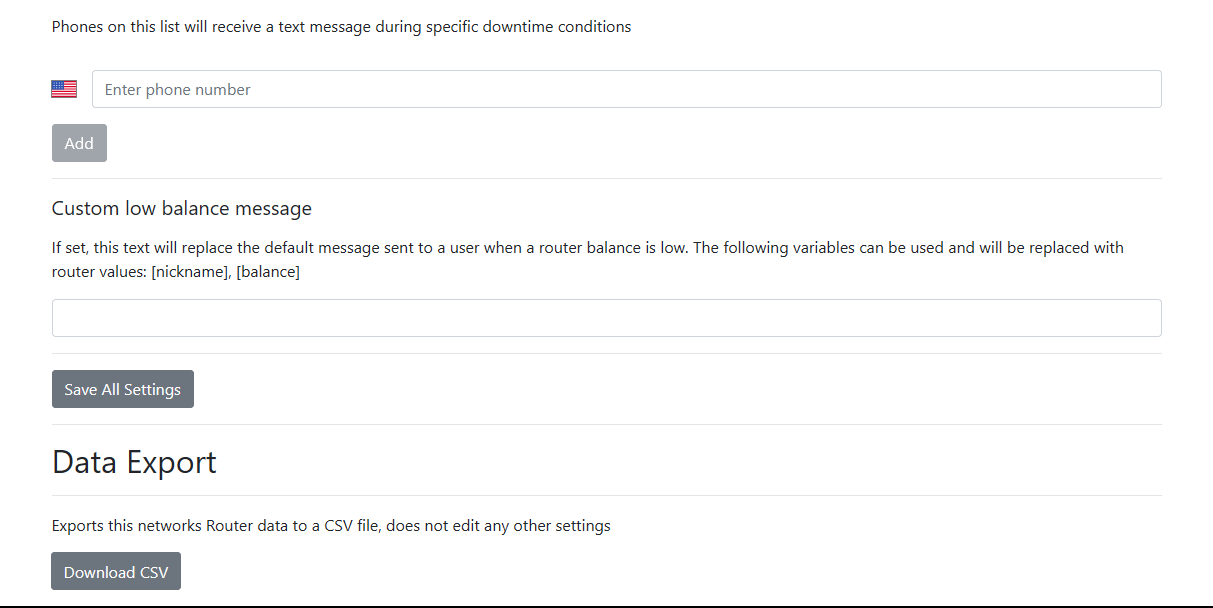
The Settings tab is, lo and behold, settings for your network. This is where you can pull the various levers that affect financial aspects of the network such as bandwidth pricing, fixed monthly costs, and relay costs. You can also customize Ops Tools notifications, choosing what type of SMS notifications you and your team would like to receive. We recommend leaving Major Downtime enabled at all times, as this is the primary notification avenue for a full network outage (a.k.a. Gateway outage).
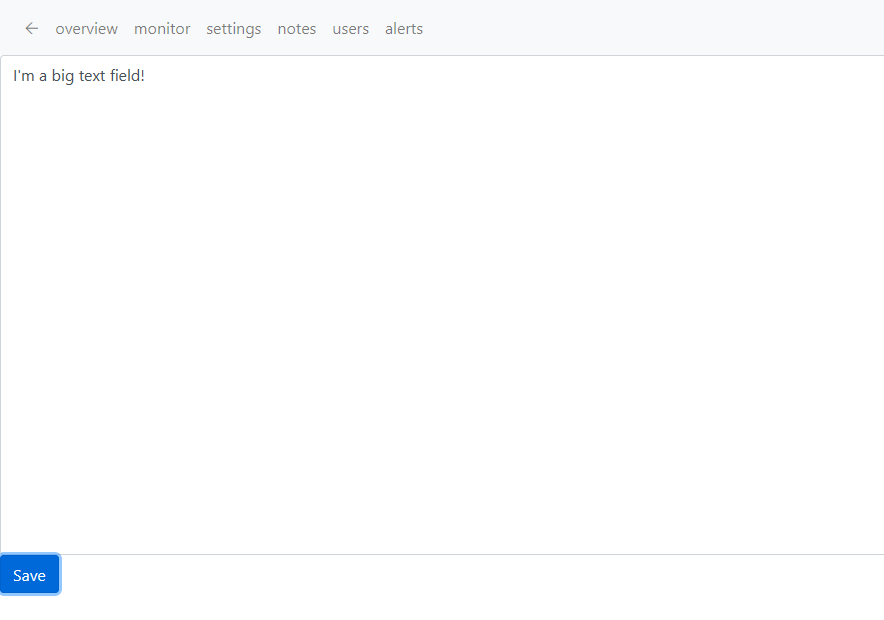
The Notes tab is simply a giant text field in which you can leave notes for yourself and your team. It’s a blank canvas.
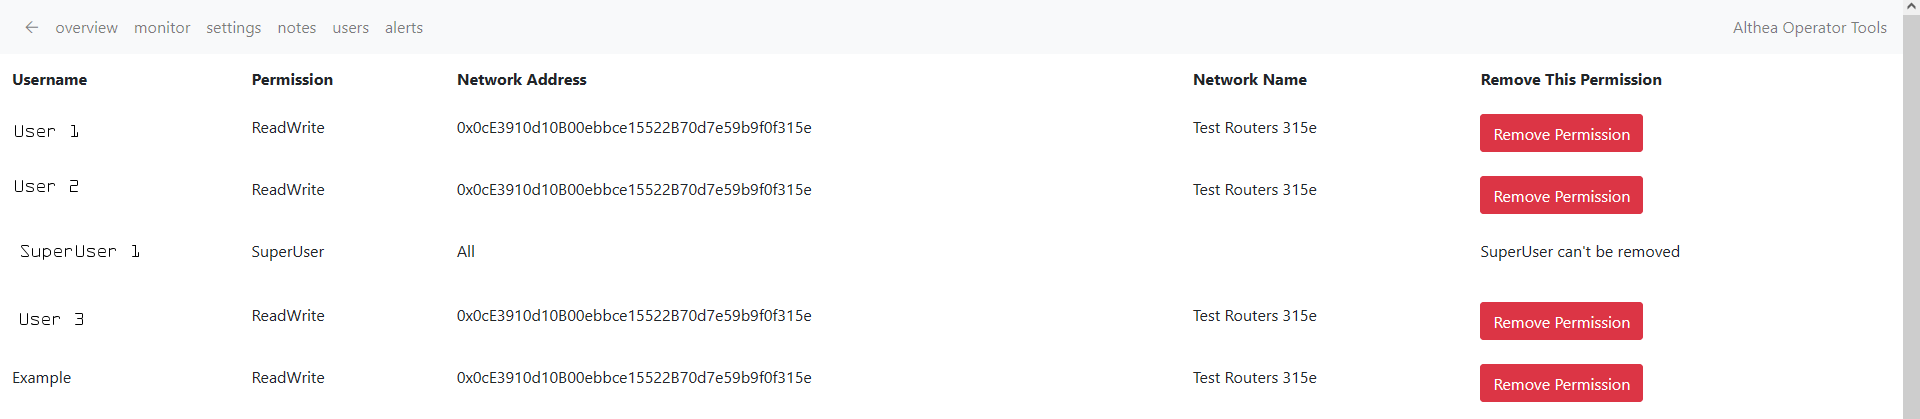
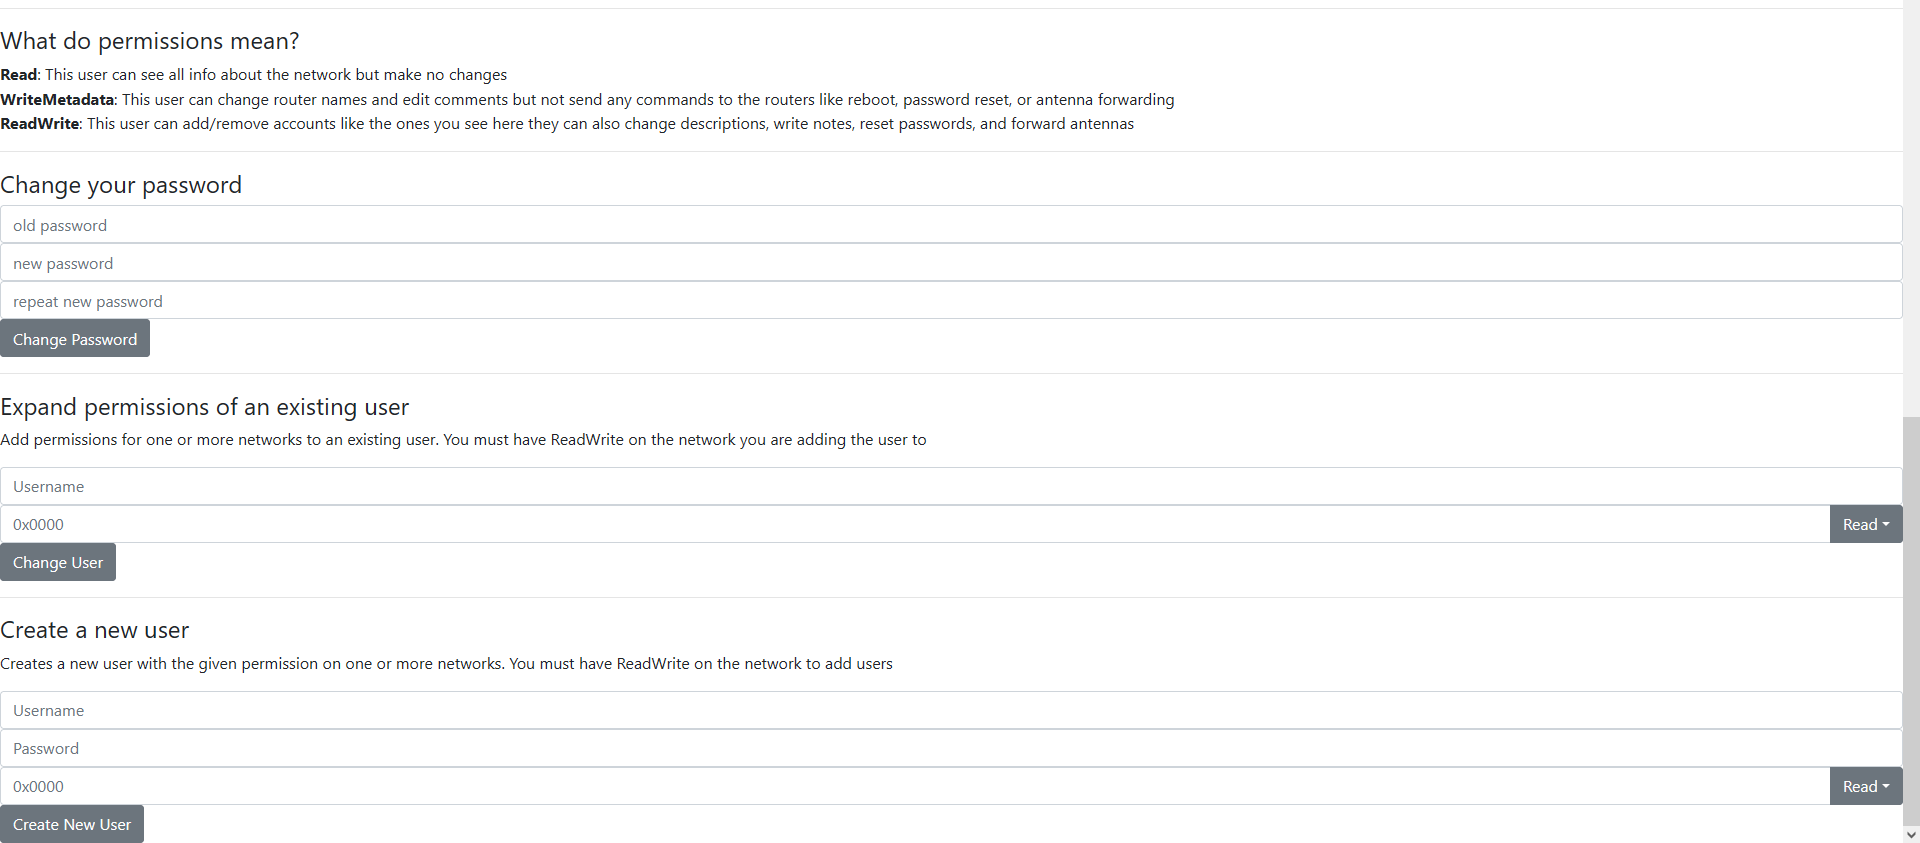
The Users tab is where you manage the users that have access to your network via Ops Tools. Available account permissions are read-only, write-metadata, and read/write. Network administrators will need read/write access to perform functions such as remotely rebooting routers, logging into radios and switches, etc. Permissions can be changed or revoked by the primary account administrator or Althea Support staff at any time.
The Alerts tab is a duplicate of all the SMS notifications that are sent out. These alerts do not clear themselves, and should be manually cleared after each incident.
Network Monitoring
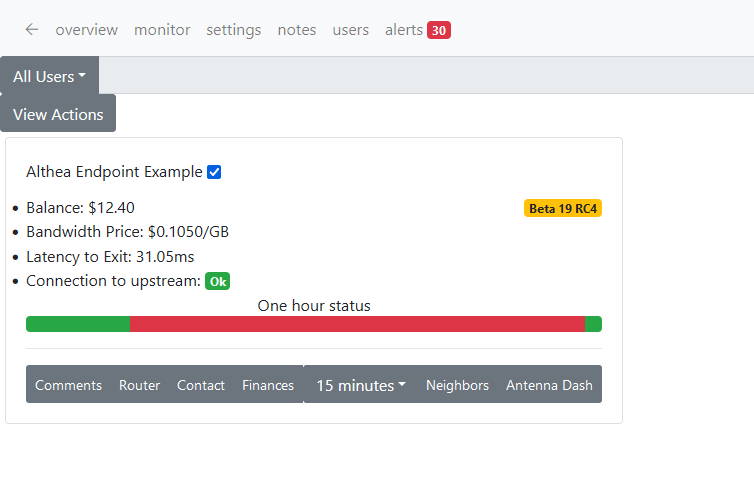
The primary function of Ops Tools is to provide the network monitoring and management tools you’ll need to operate your network. Most of this work happens on the Monitor Tab, so let’s go through the functions available on each router card.
Router Name is simply the name you give the router. By default, this field will be populated with whatever is entered in the router dashboard’s Router Nickname field. If that field is left blank, it will then populate the first WIFI SSID entered. If both are blank, then it will be populated with the Wireguard Public Key, which appears as a string of random numbers and letters. At any time you can change the router name in the Comments window.
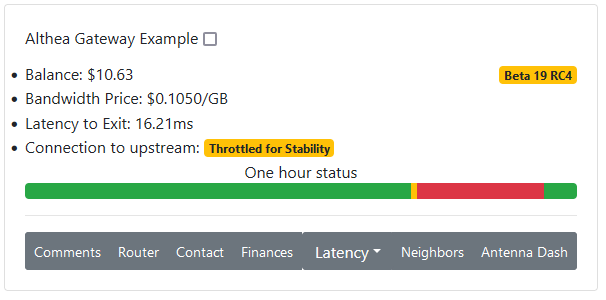
Router Balance displays the current router balance in xDAI, or whatever currency is being used.
Bandwidth Price displays that router’s net cost per GB of data (this is calculated as the sum total of all downstream and upstream traffic). This Bandwidth Price includes payments to all upstream relays, gateways, and exits.
Latency to Exit displays the average of the previous hour of the router’s latency. Since this number is an average, it is easily skewed by outliers. The instantaneous latency to exit is available on the Neighbors window, and should be cross referenced when monitoring this value.
Connection to upstream will primarily display an up or down state, with a few specific outlier possibilities. In this example, the router was recently down (because I unplugged it), then during the first few minutes of being online the bandwidth shaper throttled the connection, hence ‘Throttled for Stability’. A few moments later, the connection is flagged ‘OK’ and the throttling is automatically removed.
Firmware Version is displayed at the top right of the card. Firmware versions are color-coded based on the following rubric:
- Green - stable version
- Yellow - prerelease version
- Grey - old firmware version, upgrading to latest stable version is recommended, but not critical
- Red - known unstable version, upgrading to latest stable version or latest prerelease version is strongly recommended, possibly critical
One hour status bar shows the router’s connection state over the past 60 minutes. Green means up, red means down, and yellow indicates an outlier status. A yellow status can indicate a lot of different problem states, such as high latency to neighbor or high latency to exit.
Next let’s look at each of the pop-up windows launched from the gray buttons along the bottom of the router card.
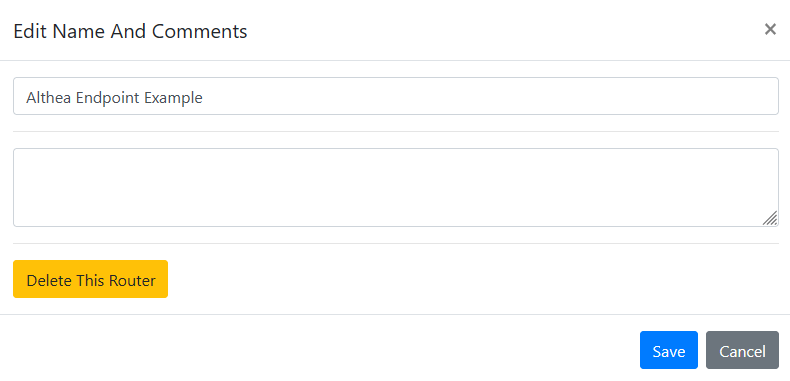
The Comments button opens the Comments window. The top text field is the same Router Name displayed at the top of the Router Card. The larger text field below is for general comments and may be used to notate any information about a client that isn’t displayed elsewhere. For example, it could be used to store details about the user’s network downstream of the Althea network, for future troubleshooting (i.e. user runs a local WIFI mesh system downstream of Althea router LAN port 1). Notes in this section will only be visible to others with access to Ops Tools. This field is not visible to the end user.
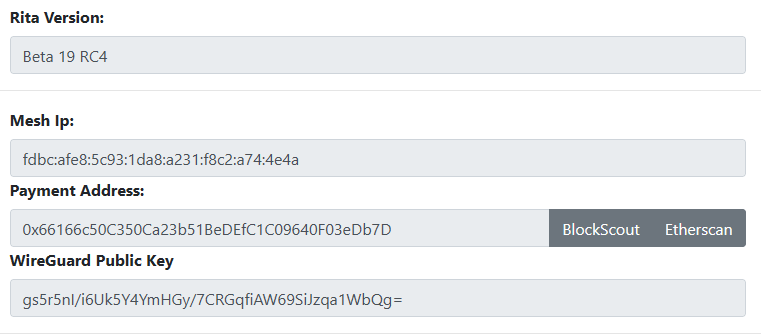
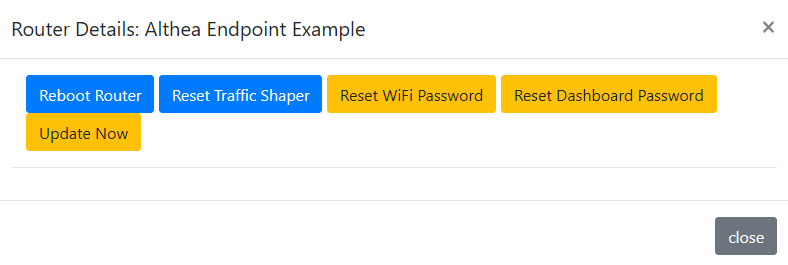
Router, always exciting, actively polls the router for up to date snapshot about its current operations. The top section contains router details such as firmware version, Mesh IP (IPv6 address), Payment Address (the customer’s wallet public key), WireGuard Public Key (useful identifier for backend troubleshooting), and quick links to BlockScout and Etherscan.
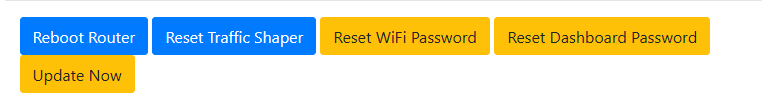
In the next section of the Router window you’ll see the buttons to send remote commands to the router, such as reboot, reset traffic shaper, reset wifi password, reset dashboard password, and update now. Some of these buttons will be missing for Operator Tools user accounts with write metadata or read-only permission levels.
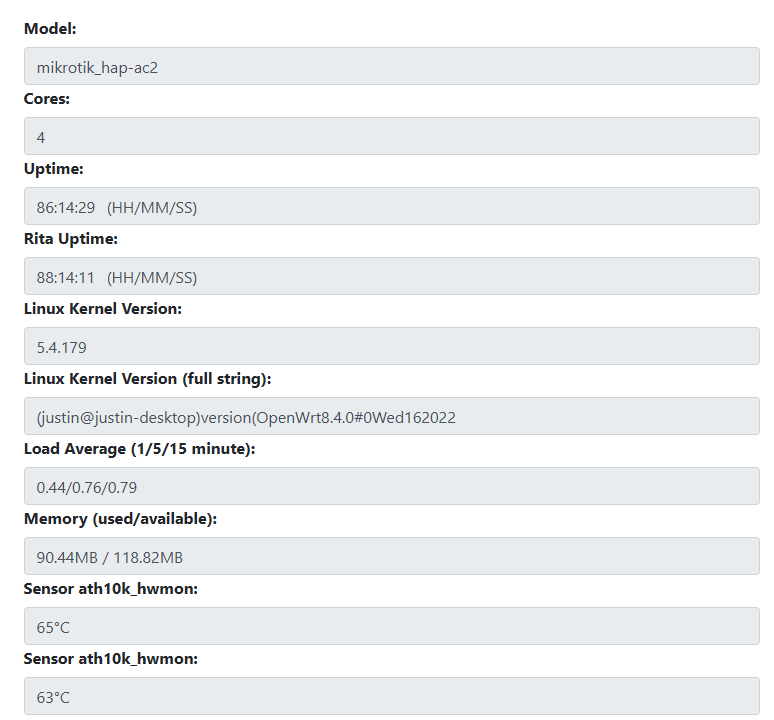
The next section of the card displays information about the router, including model number, CPU core count, uptime, Rita uptime, Linux Kernel Version, Load Averages over a 1, 5, and 15 minute timespan, RAM memory status, and temperature sensor readouts.
Load Average bears special attention, as it can be an early warning sign for a problem router. It is a counter for how many CPU cores are in use. If the Load Average is a larger number than the number of router cores, then the router’s CPU isn’t keeping up with the task of participating in the network and is introducing a bottleneck. The sensor temperatures will trigger an overheating alarm if the value exceeds the threshold. This overheating temperature threshold is custom to each router model, as each model has a different baseline operating temperature.
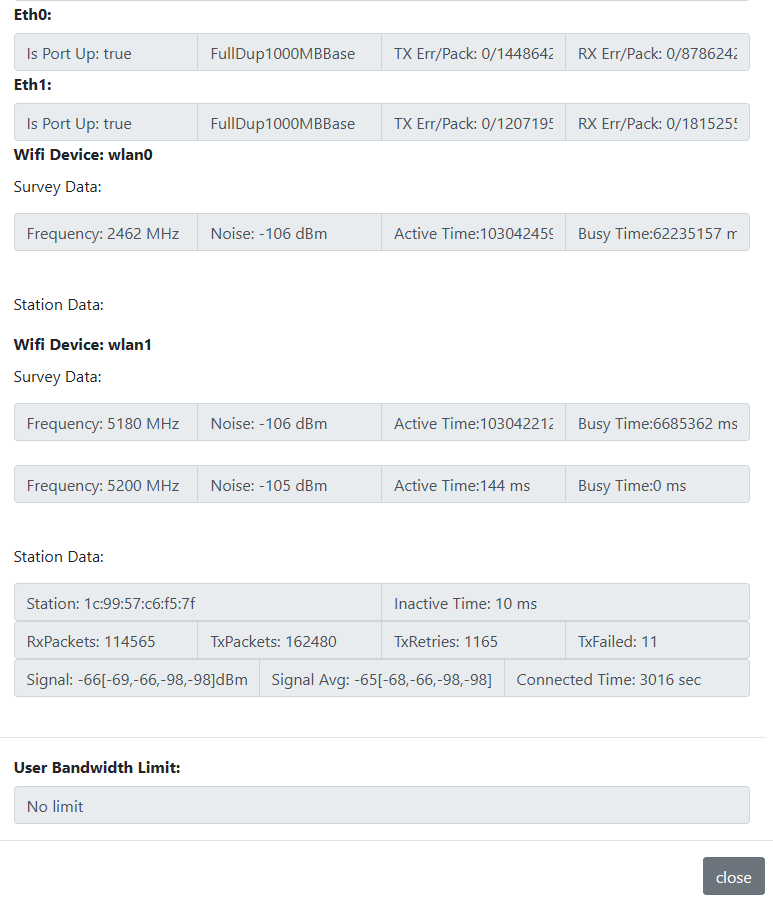
Next you’ll see the router’s Ethernet ports that are actively in use, notated as Eth0, Eth1, etc. Inactive/unplugged ports are not displayed. Ports that are active display the negotiated network connection speed, transmit errors versus packet count, and received errors versus packet count. In most cases the ideal settings for these options should be FullDup1000MBBase (1 Gbps) and 0 reported TX or RX errors.
Each WIFI Device is also displayed. Some routers are dual or triband, so you may see 2 or 3 different WIFI networks displayed here, notated as wlan0, wlan1, etc. The broadcasting frequency, noise floor, and time metrics are displayed.
Even more exciting, the WIFI Station data is presented next. These are the actual devices the user has connected to the router’s WIFI networks. User device connection time, signal strength, packet counts, retries and errors are all visible here. This data is useful for troubleshooting poor or slow performance, as sometimes the issue is between the user’s device and the WIFI router, instead of upstream in the Althea network.
Finally, if the user has set a User Bandwidth Limit (Router Dashboard/Advanced), it is displayed here.
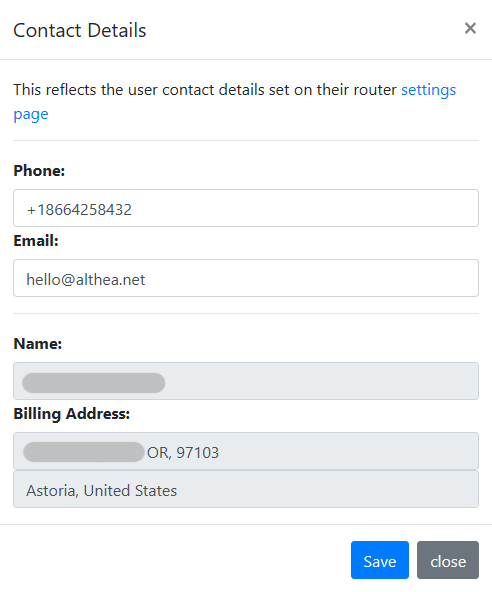
Contact shows the user’s information. These fields can be edited directly in Ops Tools, and the values will be saved to the Ops Tools database. Within a few heartbeats, the values will be synced down to the router itself as well. This is a bidirectional sync, and if there is a conflict between the router and Ops Tools database, the most recent entries will be displayed. This allows either the network operator or user to keep the contact info up to date.
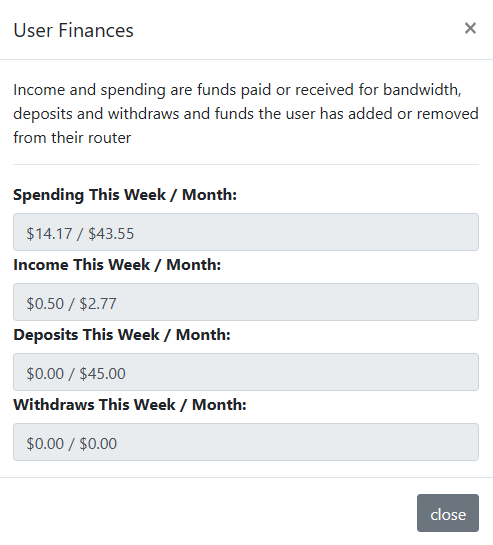
Finances displays the user’s financial metrics, such as spending, income, deposits, and withdraws per week and per month. While this is a helpful overview, the user has a far more in-depth view into their router’s finances and bandwidth usage at Router Dashboard/Finances.
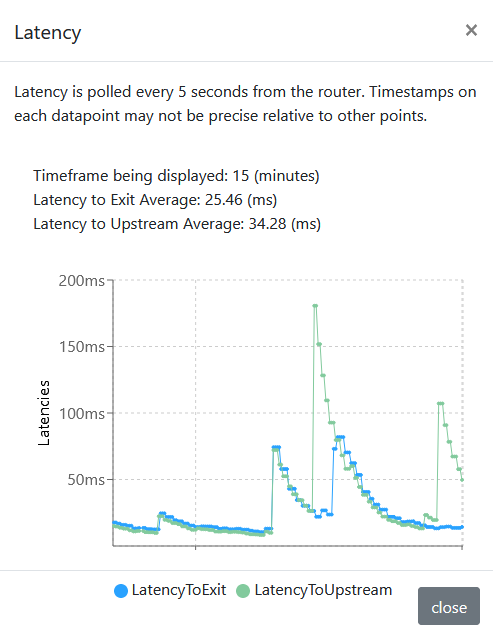
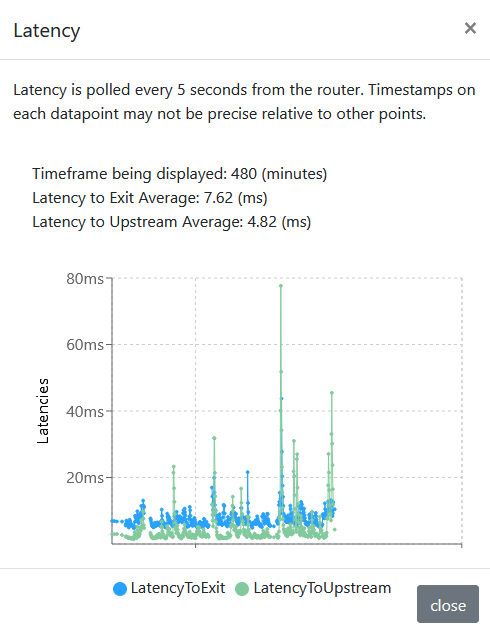
Latency provides options for different time periods, 15 mins, 1 hr, 8 hr, and 24 hr. Selecting one of these will generate a graph of average router latency over that time period. Values of latency to upstream (the next hop in the network), and latency to exit (the summation of all hops in the network) are charted across a time X axis. The latency measurement in milliseconds Y axis of the graph will automatically scale as needed. If a router goes offline, the latency goes to infinity, so the graph will show a sharp vertical spike. The ideal latency graph would be a flat horizontal line and a value of 20 ms or below. A realistic (and still very good) latency graph will vary between a few ms up and down, and look fairly flat when viewed from a longer time scale. The latency graph for a poorly operating router is likely to have sharp spikes upwards and be very uneven.
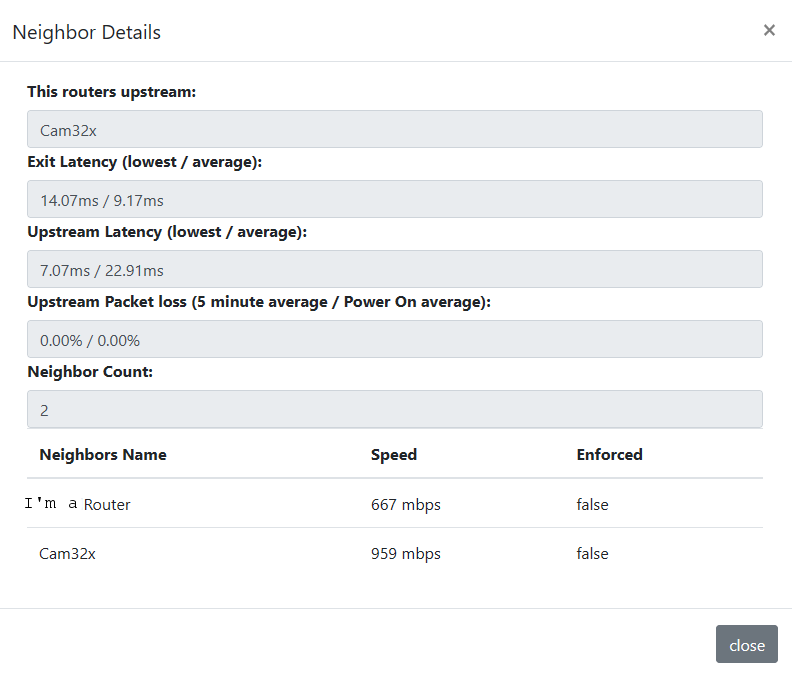
Neighbors displays important information about the router’s participation in the network. The name of the router’s upstream is displayed. Note this name is polled from the Router Nickname, so it may differ from the Router Card Title specified in Ops Tools. Exit Latency and Upstream Latency are displayed with lowest and average values. The lower the better. Upstream packet loss is also displayed, both a 5 minute average and the running average since the router was last powered on. Next is the Neighbor Count, and the table showing all neighbors that the router can see. Both upstream and downstream connections are displayed here, as well as any router visible through the router’s MESH or WAN ports.
Note that if your network topology is such that all Althea routers are connected to a large layer 2 network and switching domain (which is a common design for many WISPs), then every other Althea router in the network may be displayed as a Neighbor, regardless of the number of hops between the two routers. This is not a bug, but it is not a feature either. It is merely an artifact of how Althea routers find each other over a network. We suggest you break up layer 2 networks using althea routers if that’s practical for your network. The routing protocol will bridge them much more efficiently than an L2.
The Speed column in the neighbors table reports on the actions or inactions of the Bandwidth Shaper (an Althea feature discussed in /pages/how-althea-works). It displays the ceiling of the bandwidth limit that the Bandwidth Shaper has placed between the router and its neighbor. If “Unlimited” is displayed, this means the Bandwidth Shaper has detected no issues and is doing nothing. If a number of mbps is displayed, the Bandwidth Shaper has detected unstable latency and is throttling that link to fine tune performance. The minimum value is specified by the Network Operator (that’s you).
Antenna Dash is another exciting Ops Tools feature. It allows you to forward traffic into any device connected to a router’s MESH or WAN ports. It does not give you access to devices connected to a router’s LAN ports, as these are considered to be user devices and therefore should be inaccessible to the network operator. It is named Antenna Dash because the most common use-case is to remotely log into a radio’s management dashboard, however it can also be used for remotely managed devices such as switches, uninterruptible power supplies, solar controllers, etc.
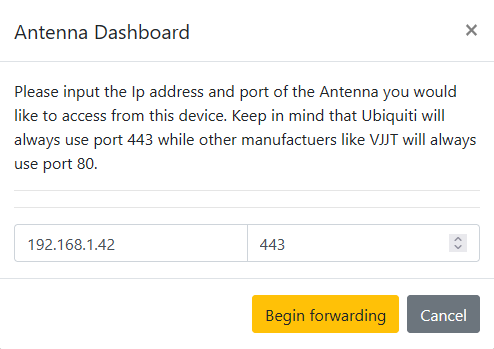
Enter the device’s IPv4 address and port (generally either 443 or 80). Click Begin Forwarding and wait, it can take a few minutes for the URL to populate, depending on how long the device takes to respond, and how large the upstream layer 2 network is.
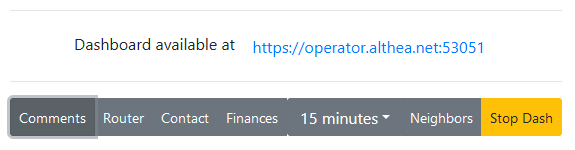
Click the link and your browser will launch a new tab providing access to the device’s management dashboard.
Bulk Actions
Operator Tools also has the ability to send the same command to multiple routers simultaneously. To use Bulk Actions, select one or more of the tick boxes next to the Router Card Title.
Next, click the View Actions button at the top left, and you’ll see the Bulk Actions window. Router Details displays a list of all router cards selected.
The Bulk Actions displayed here are identical to what is found on the router tab. Exercise caution when using bulk actions, there is no undo. The primary use case for Bulk Actions is running router firmware updates in a more efficient manner. An update scheduling feature is also in development.
Sort, Filter, & Keyword Searches
The Ops Tools Monitor page can be sorted and filtered in different ways. By default, each view is sorted by router balance, highest balances at the top, and lowest at the bottom. This is convenient for quickly identifying routers with a low balance that are at risk of being enforced (throttled for non-payment) to the Free Tier.
For networks of 25+ routers, a new option is presented: Users experiencing issues. This is a filtered view of all routers that have a Connection to upstream that is any value besides Ok. This becomes the default Ops Tools Monitor page view for larger networks.
Click the All Users button at the top left and select Search. Enter a keyword to search for, such as a user name, phone number, address, etc. Despite the name, this is a global search and will return any keyword parameter from all the router cards in that network.
The Search tool is very powerful, but can easily return too many results to be helpful. The Comments field can contain keywords to refine search results. Think of this a bit like hashtags. Identifier words such as Gateway, Relay, and Endpoint can be added to every comment field, as quick and easy keywords. Search “gateway” and quickly check the status of every gateway in your network. If you want to take the concept further, you can also have short and easy-to-remember nicknames for key sites. If you have a relay named RadioTower1, you can add the keyword RadioTower1 to the comments field of every router downstream of that relay. Then if the relay has an issue, you can search RadioTower1 and see every user who is affected by that issue. This can also be very helpful in finding the subset of users that need to be notified about a relay’s upcoming maintenance. With this in mind, thoughtful implementation of keywords from the onset is highly recommended: you’ll thank yourself later.
Tips & Tricks
Althea Operator Tools is designed to be somewhat of a blank slate, where it provides you with the information you need to see, but gives you enough customization and flexibility to allow you to design your own organizational structure, instead of imposing one on you. Take advantage of the variety of editable text fields and settings to tailor the Althea platform to your needs. If you have a large team, instilling procedures from the beginning about user information notation, keywords, static IP addressing schemes, and so on will save you many future frustrations. Ops Tools is a very advanced network notebook, but you still have to make your own journal entries.
As for tricks, well I’ve explained everything Ops Tools does pretty thoroughly already, so I have just one: when using Antenna Dash, keep in mind that the traffic is routing through the router from which you launch the Antenna Dash link. So if you are logging into a router’s downstream link (an outgoing radio AP for example), then this is logical, as that router is directly connected to the device you are trying to access. However, if you want to log into a router’s upstream radio (the one that is providing the router access to the internet), then the shortest number of hops to that device is actually from the upstream router’s Antenna Dash. The packets would travel like this:
Ops Tools servers > Althea Exit > Althea Gateway > Althea Relay(s) > Relay Outgoing AP > Endpoint receiving station
As opposed to this longer path with a hairpin turn at the last few steps, if you were to launch Antenna Dash from the Endpoint router’s card:
Ops Tools servers > Althea Exit > Althea Gateway > Althea Relay(s) > Relay Outgoing AP > Endpoint receiving station > Althea Endpoint Router > Endpoint receiving station
If your network topology is such that all Althea routers are connected to one large layer 2 network and switching domain, then you can use any Althea router to Antenna Dash into any other router’s device. This means you can conveniently run all Antenna Dash searches from a Gateway router directly. The downside is a potential IP conflict, as Antenna Dash will return whichever device responds first, which may not be the device you are trying to access. This illustrates why a proper IP addressing scheme to prevent IPv4 conflicts is critical! Never reuse or share an IP address for any device in your network.